Search for a free infographic maker and you will find dozens of tools that promise the same thing: type a topic, get a polished visual in seconds. Then you click export and hit a wall. Two downloads a month. A watermark across the bottom corner. PDF output locked behind a paid plan. This article sorts out what a free infographic maker AI actually gives you in late 2026, how editable templates behave in practice, how to turn a PDF into an infographic without mangling the numbers, and what the paid tiers really cost.
A quick warning before we start: prices and credit limits in this category change almost monthly, and reviews often disagree with each other. Every figure below is a reported range, not a promise. Check the pricing page of any tool before you hand over a card.

What "Free" Really Means
The word free is doing a lot of work on these landing pages. In almost every case it means free to design, not free to publish. You can open the editor, drag blocks around and watch the AI draft a layout. The moment you want a clean file, the limits appear.
The Three Typical Caps
Most free plans hit you in one of three places:
- Download caps. Some tools allow only two or three exports a month. One review reports two PNG downloads a month on a popular free tier, another says three.
- AI credits. Generation is metered. Reported free allowances range from a handful of generations per day to a monthly pool of around 60 credits, and a weekly pool of 500 credits on at least one tool.
- Format limits. PNG is usually free. PDF, SVG and PowerPoint are commonly reserved for paying users, though a few tools bend that rule.
💡 Tip: Count your real needs before comparing plans. If you publish one infographic a month, a two-download cap is fine. If you build a weekly newsletter visual, it will break by the second week.
Watermarks and Commercial Rights
Two details get missed more than anything else. First, many free exports carry a small badge or watermark. That is fine for a draft, but not for a client deck. Second, at least one design tool restricts its free plan to personal use only, which means no commercial rights. If you are making visuals for a business, a shop or a paid newsletter, read the license line before you invest an hour in a layout.

Editable Templates Worth Using
An AI-generated infographic that you cannot edit is a screenshot. The whole point of a template is that you can change a number, swap a color or fix a typo without starting over.
What Editable Should Include
Test three things in the first five minutes of any free plan:
- Text you can retype directly on the canvas, not baked into a flat image.
- Charts connected to data. You should be able to paste or type new values and watch the bars resize.
- Icons and blocks you can swap individually, including colors and fonts.
If the AI output arrives as one flattened picture, treat it as a mood board and not a finished file. The better tools generate real layers: headings, shapes, chart objects, icon groups. Those you can fix when the AI misreads a figure, and it will misread one eventually.
Template Libraries Compared
Libraries differ wildly in size and taste. Canva has the broadest free pool, with a huge number of layouts across every format. Venngage offers its full template library even in free generation, according to its own tool page. Piktochart leans toward report-style and presentation-style infographics, while Visme limits free users to a smaller set of templates, assets and AI tools. Infogram ties its free access to a Microsoft account.
| Tool | Template strength | Best for |
|---|
| Canva | Largest free library, social and print sizes | Quick posts, flyers, mixed content |
| Venngage | Dedicated infographic layouts, full library on free generation | Statistics and process visuals |
| Piktochart | Reports, presentations, long-form infographics | Business and education use |
| Visme | Data-heavy, smaller free pool | Charts and branded decks |
| Napkin AI | Text-to-diagram drafts | Turning notes into simple visuals |

PDF to Infographic, Step by Step
Turning a PDF into an infographic is the use case people ask about most, and the one tools handle least evenly. A ten-page report has a message buried inside it. The job is to pull out four to seven facts and give each one a visual home.
Prepare the Source PDF
Do not upload the raw document and hope. Spend five minutes first:
- Highlight the facts that matter. Pick one headline number, two or three supporting stats and one process or timeline.
- Remove scanned pages. Image-only pages are often unreadable to the AI. If your PDF is a scan, run text recognition first or paste the text in manually.
- Trim the length. Free plans usually cap upload size or credit usage. A short summary page often gives a better result than a forty-page annual report.

Let the AI Draft
Upload the PDF or paste the extracted summary and ask for a specific format: vertical long-form, a one-page poster, or a square social card. Name the audience as well. "A one-page poster for school administrators" gives a very different layout than "a square card for LinkedIn". Most tools spend one or two credits on a first draft, so you can usually afford three variations on a free plan.
Fix What the AI Got Wrong
This is where careful people save themselves from embarrassment. Check every number against the source PDF. AI drafting tools sometimes round figures, swap the order of two categories or invent a plausible label. Then check the story: does the top of the infographic state the main point? Does the eye move down the page in a logical order? Cut anything that does not serve that point.
💡 Tip: Keep the PDF open in a second window. Read each number aloud from the source and tick it off in the infographic. It takes three minutes and catches almost every error.
Limits and Pricing Compared
Here is the part most readers scroll straight to. The table below combines recent reviews and vendor-facing summaries. Where sources disagreed, I list the range.
Free Plan Limits Table
| Tool | Reported free tier | Watermark or badge |
|---|
| Piktochart | About 60 AI credits a month, a small number of downloads, limited storage | Yes, reported on exports |
| Venngage | About 5 AI generations a day, PNG export | Yes, reported |
| Canva | Broad free plan with many templates | Reports conflict, check your export |
| Visme | Around 3 projects and 100 MB storage | Badge on published content |
| Napkin AI | About 500 AI credits a week, PNG and PDF export reported on free | SVG and PPT paid |
| Kittl | Free plan for personal use | No commercial rights |
Paid Plan Costs
Paid pricing varies by billing cycle, and annual plans are cheaper per month than monthly ones.
| Tool | Reported starting price |
|---|
| Piktochart Pro | About $14 a month billed annually, about $29 billed monthly |
| Venngage | Roughly $10 to $25 a month, depending on plan and billing |
| Canva Pro | Reported between about $13 and $20 a month |
| Visme | Starts around $12 a month |
Notice how tightly bunched the entry prices are. Nobody wins on price alone at the low end, so the decision usually comes down to export formats, template taste and how many designs you need each month.

Which Plan Fits Whom
- Occasional user: Stay on a free tier and export PNG. Accept the watermark for internal drafts, or crop it out only where the license allows.
- Student or teacher: Look for education pricing before paying list price. Several vendors discount or waive fees for schools.
- Freelancer or small business: One monthly paid plan usually pays for itself in the first client project. Pick the one whose PDF and brand-kit options match your clients.
- Team: Compare seat pricing, not just the headline per-user rate.

Where AI Image Models Fit
Template tools are great at structure. They are weaker at original artwork: a warm hero scene, a custom illustration for a story, a background with real depth. This is where image models come in. They do not replace an infographic editor, because they output pictures and not editable chart layers. But they give you assets to drop into one.
Icons and Illustrations
For vector-style graphics, Recraft v4.1 SVG is built around scalable vector output, which suits icons, badges and simple spot illustrations that stay sharp at any size. Its heavier sibling, Recraft v4.1 Pro SVG, is worth trying when you need more detail. If you want print-ready raster artwork, Recraft v4.1 Pro targets higher-resolution output.
Backgrounds and Hero Art
When an infographic needs a banner image or a photographic header, a general image model does the job. Ideogram v4 Quality and Ideogram v4 Balanced are good first picks when you want precise compositions. GPT Image 2 is a strong all-round option for prompt-faithful scenes. Nano Banana Pro and Seedream 4.5 are both worth testing for realistic photographic backgrounds in 4K.
A practical workflow looks like this:
- Draft the layout and data in your favorite template tool.
- Generate a header image, background or icon set with an image model.
- Upload those assets into the editor and place them behind or beside your charts.
- Export PNG for the web, or PDF if your plan allows it.
💡 Tip: Ask the image model for no text in the image. Let the editor handle every word and number, so you can edit them later without regenerating anything.

Mistakes That Waste Your Free Quota
Free plans punish sloppy work because every retry costs a credit or a download. These three habits burn through allowances fastest.
Exporting Before Proofreading
A two-download plan gives you almost no room for typos. Proof on screen first. Zoom to 200 percent and read every label. Then export once.
Prompting Too Vaguely
"Make an infographic about climate" will give you a generic poster that you then rebuild by hand. Give the tool a title, three to five bullet facts, the target size and the audience. Specific prompts cost the same single credit and need fewer retries.
Ignoring the Output Size
Social cards, A4 posters and long-form web graphics use different proportions. Pick the right canvas before generating, because resizing afterward often breaks the layout and sometimes costs another export.

Printing and Presenting Your Result
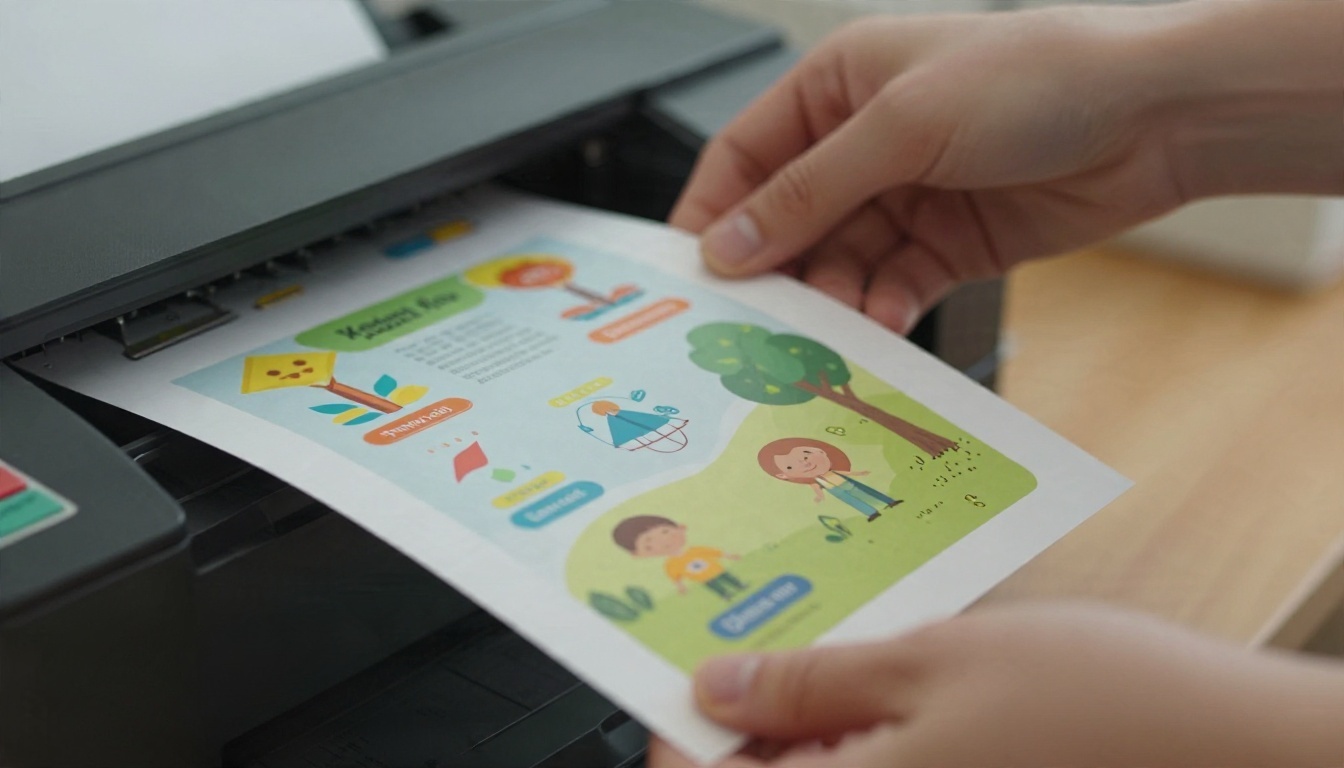
If your infographic will be printed, pay attention to resolution. A PNG from a free plan can look fine on a phone and soft on paper. Export at the largest size your plan allows, and if you only have a small file, run it through a super resolution model before printing. Check how colors look on paper too, since screens tend to show brighter tones than printers produce.
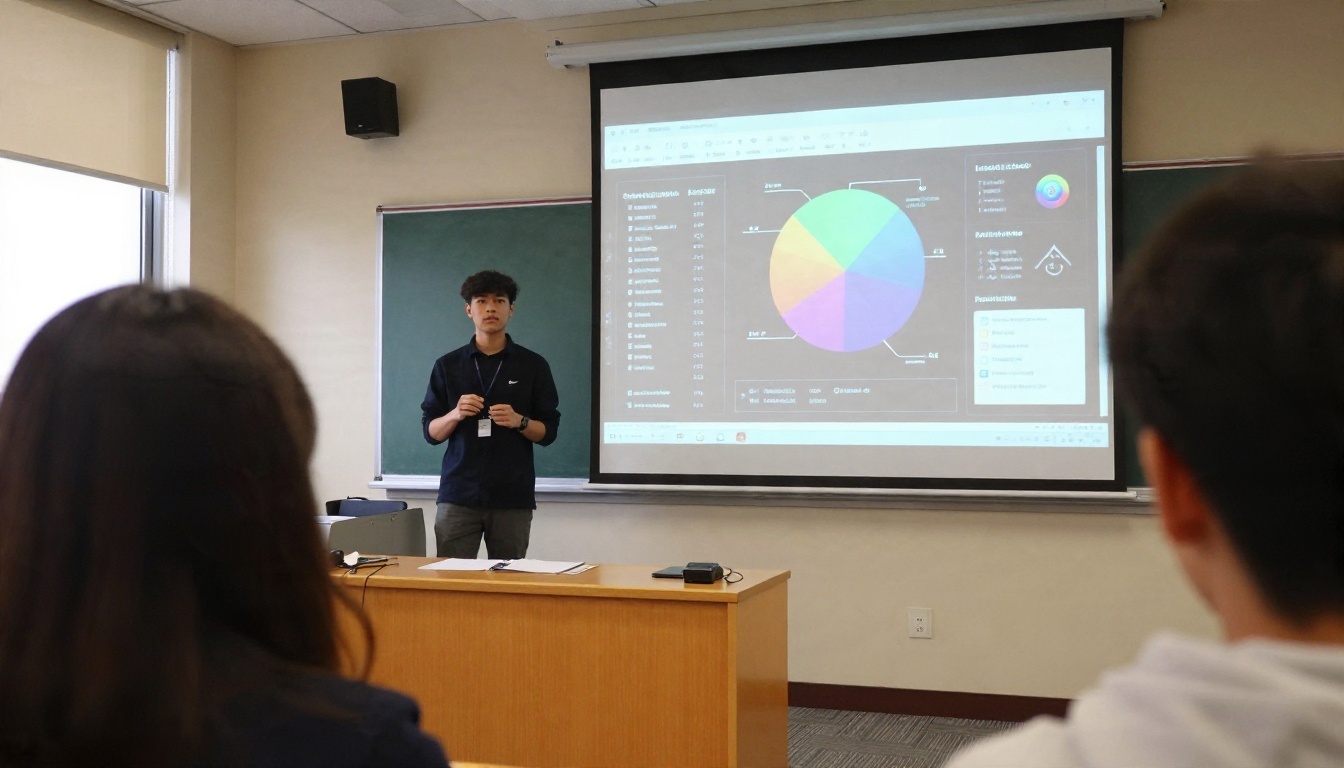
For presentations, keep one idea per slide. A long infographic is a poor slide, and a cropped long infographic is worse. Split it into three or four panels instead, each with one headline number. Students and conference speakers do this naturally, and audiences remember the single clear panel far more than the dense page.
Make Your Own Visuals Today
The honest summary: a free infographic maker AI is excellent for drafting and decent for light publishing, and the paywall usually sits at PDF export, clean downloads and heavy AI use. Pick a free tool that exports the format you need, check the license, and keep your first designs short.
For the artwork that templates cannot provide, open PicassoIA and try the image models above. Generate a header scene, an icon set or a photographic background, then drop it into your layout. Start with Ideogram v4 Quality or Recraft v4.1 SVG, write a short prompt, and experiment with a few styles until one fits your data. Browse the full catalog at picassoia.com/en/all-models and see how far a single prompt can take your next infographic.


