You have a pile of numbers, a deadline, and zero design skills. A few years ago that meant hours in a layout tool, dragging icons around and fighting with fonts. Today you can type two sentences into an AI infographic maker, wait a few seconds, and get a clean, readable visual you can post, print or drop into a slide deck.
This article is written for people who have never made an infographic before. You will see what these tools actually do, which free online options are worth your time, how to write a prompt that gives you a usable result on the first or second try, and ten ready-to-paste examples. No design vocabulary required.

💡 Quick answer: An AI infographic maker turns a text description into a finished layout with charts, icons, headings and color. For the best result, name the topic, the data points, the layout style and the color palette in one short prompt.
What an AI Infographic Maker Does
An infographic is a picture that explains something. It might compare three products, show the steps of a process, or turn a survey result into a bar chart. The old workflow had you collect data, choose a template, and adjust every element by hand.
An AI infographic maker skips most of that. You describe what you want, and an image model draws the whole thing: layout, shapes, icons, typography and background.
From Text to Visual
The process has three moving parts:
- Your prompt. A short description of the topic, the data and the look.
- The model. It reads your words, plans a layout, and renders pixels, including any text you asked for.
- Your edits. You review the result and regenerate with a small change, such as "make the headline larger" or "use a blue palette."
Think of it as briefing a very fast junior designer. The clearer your brief, the fewer rounds you need.
Where AI Still Struggles
Be honest with yourself about the limits, because they shape how you write prompts.
- Exact numbers. A model may draw a bar chart that looks right but does not match your data to the decimal. For anything financial or scientific, check every value.
- Long paragraphs. Small text inside a graphic is where mistakes creep in. Short labels work far better than full sentences.
- Brand consistency. Matching a precise logo or hex color usually needs a second pass or an editing step.
💡 Rule of thumb: Let the AI handle the layout and look. You handle the facts.
Free Online Options for Beginners
Searching for a free tool turns up two kinds of products. The first is a template-based design site with an AI button added on top. The second is a pure image model that draws everything from your text. Both can work, but they behave differently.
What "Free" Usually Means
Most free plans share the same trade-offs. Expect a limited number of generations per day or month, a watermark on exports, lower resolution on the free tier, or all three. None of that is a problem while you practice. It becomes one when you need a sharp print for a classroom wall or a client presentation.
Before you commit to any tool, check four things:
| Question | Why it matters |
|---|
| How many free generations do I get? | Beginners need 5 to 10 attempts per project |
| Is there a watermark? | Watermarks make a graphic unusable for work |
| What is the maximum resolution? | Print needs far more pixels than social media |
| Can I edit the result with a text instruction? | Saves you from starting over every time |
Models Worth Trying
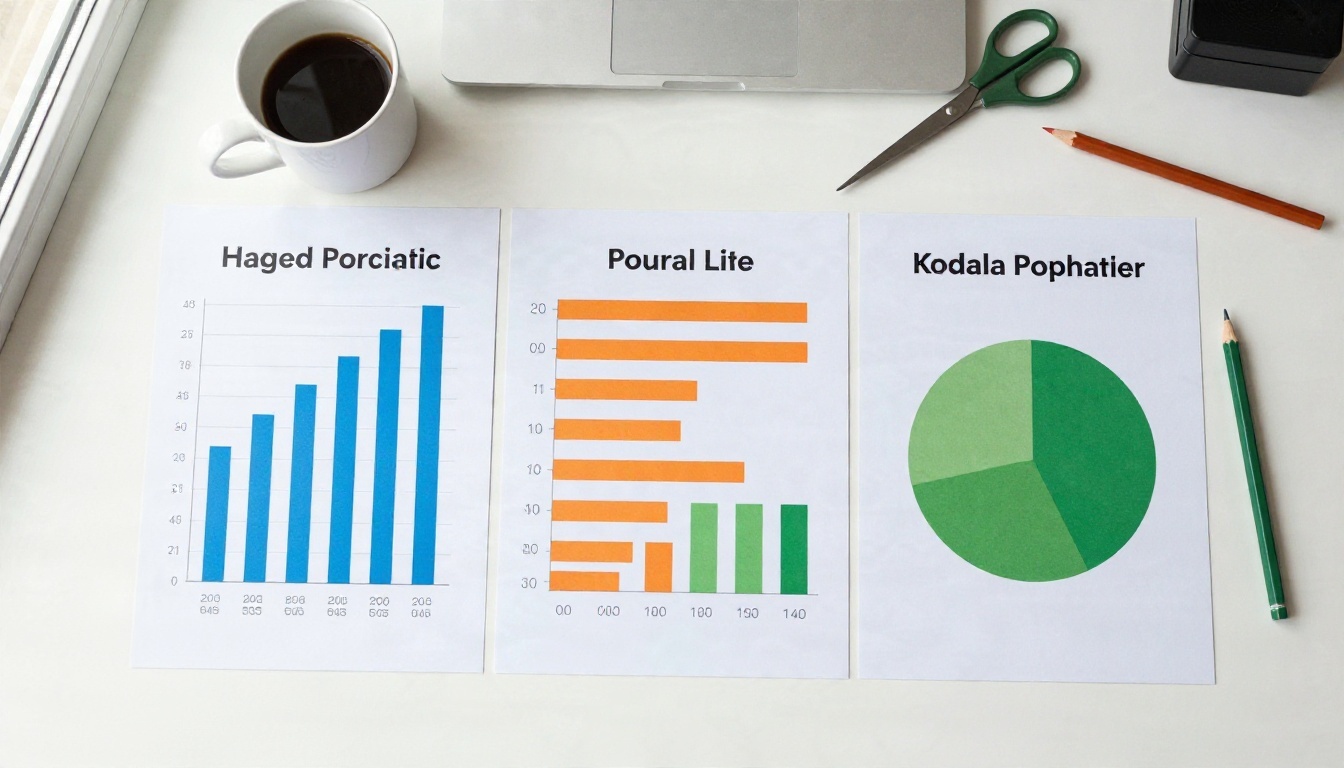
If you want an infographic with readable text, pick a model known for typography. These are the ones I would test first on PicassoIA:
No single model wins every time. Run the same prompt through two of them and keep the better one. That habit alone will improve your results faster than any prompt trick.
How to Use Nano Banana Pro on PicassoIA
Nano Banana Pro is a good first choice because it handles short text labels well and lets you adjust a result with a plain instruction. Here is the full routine.
Step by Step
- Open the Nano Banana Pro page on PicassoIA.
- Paste your prompt into the text box. Use the formula in the next section.
- Set the aspect ratio. Choose 16:9 for slides, 1:1 for social posts, or 9:16 for tall vertical infographics.
- Click generate and wait for the preview.
- Check every word and number. If something is wrong, write a short follow-up such as "fix the spelling of the second heading" and generate again.
- Download the image when you are happy with it.
Settings to Adjust
- Aspect ratio. The most important setting. A tall layout gives a process room to breathe. A wide one suits comparisons.
- Resolution. Pick the highest option when you plan to print.
- Iteration. Change one thing per attempt. If you change five things at once, you will never know which one helped.
💡 Beginner tip: Keep your first prompt under 60 words. Add detail only after you see what the model does with the basics.
Most weak results come from vague prompts. "Make an infographic about coffee" leaves the model to guess everything. A stronger prompt answers five questions.
The Five-Part Structure
- Format. "Vertical infographic poster" or "wide slide-style infographic."
- Topic. One sentence about what it explains.
- Content. The exact headings or data points, kept short.
- Style. Flat icons, clean grid, minimal, editorial.
- Color and background. "Navy and orange on an off-white background."
Put together, it reads like this:
Vertical infographic poster explaining how coffee goes from farm to cup in 5 steps. Headings: "Grow", "Harvest", "Roast", "Grind", "Brew". One simple flat icon per step, connected by a thin line. Clean grid, lots of white space. Dark brown and cream color palette.
That is 50 words, and every one of them gives the model something to act on.
Words That Help Readability
Certain phrases quietly improve the result:
- "Lots of white space" reduces clutter.
- "Large bold headline" keeps the title readable at small sizes.
- "Consistent icon style" stops the model from mixing cartoon and line icons.
- "Maximum 6 words per label" keeps text short, which cuts spelling errors.
- "Left-aligned, clear hierarchy" gives the eye a path to follow.
Examples and Prompts to Copy
Here are five realistic situations, each with a prompt you can paste directly. Swap the details for your own topic.
Classroom Poster
A teacher wants a visual for a science unit. The goal is something a ten-year-old can read from the back of the room.
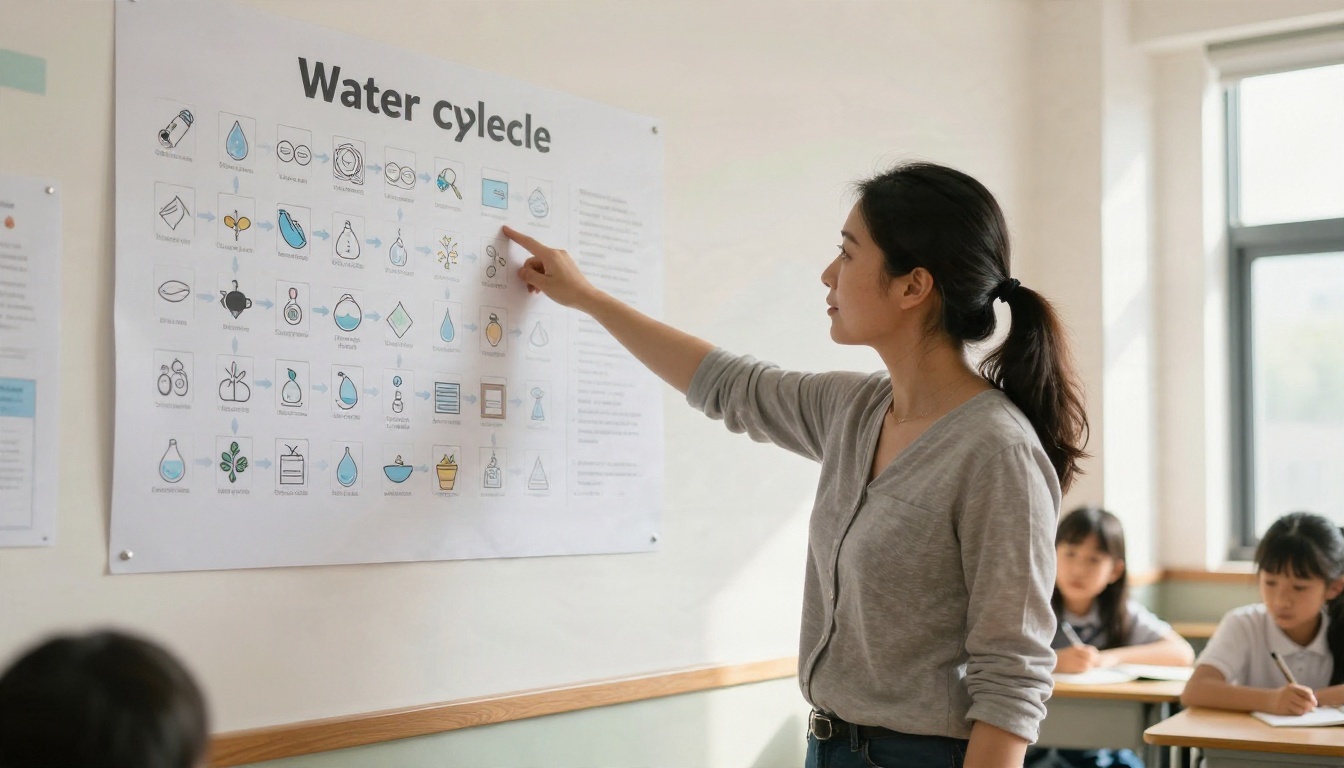
Prompt: Educational infographic poster about the water cycle, wide format. Four labeled stages: "Evaporation", "Condensation", "Precipitation", "Collection". Simple friendly icons, arrows between stages, large title at the top. Bright blue and green palette, white background, very readable from a distance.
Business Funnel
A marketing team needs to show how visitors become customers.
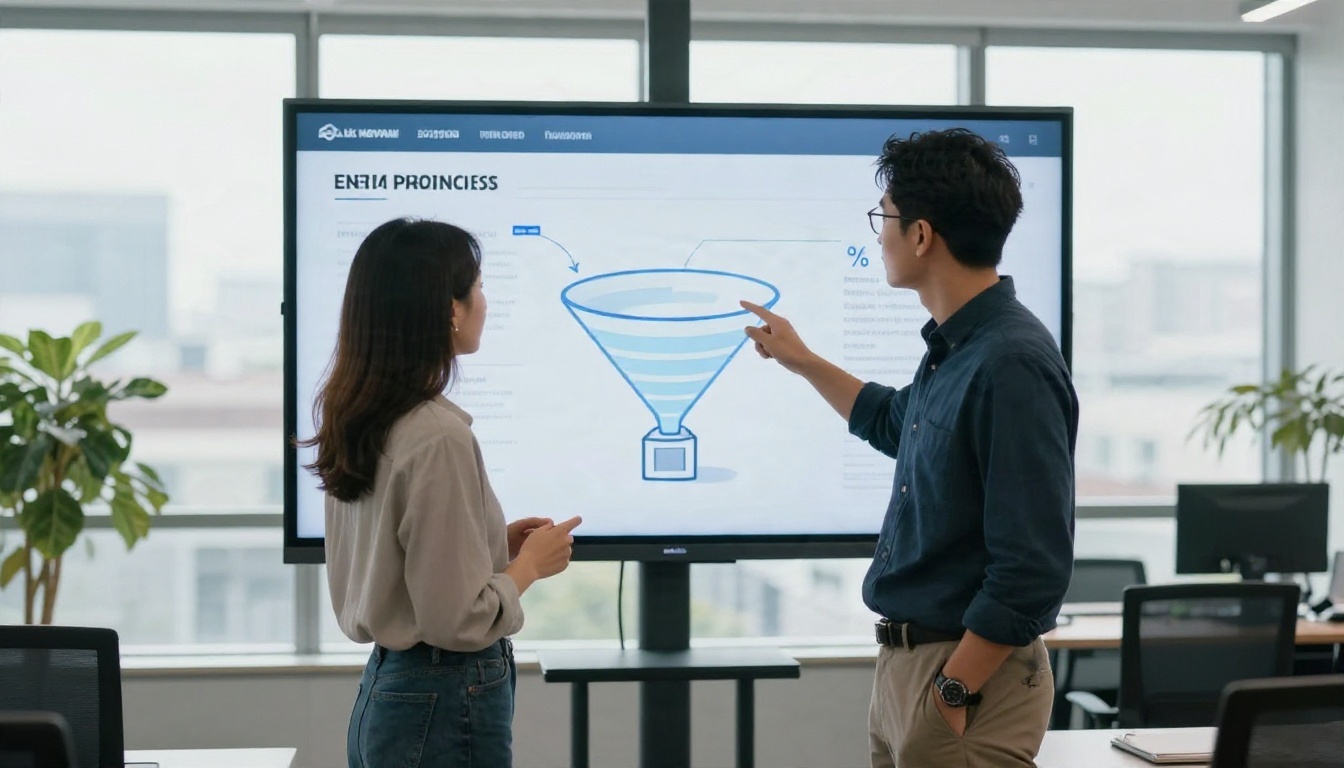
Prompt: Slide-style infographic with a four-level sales funnel. Labels: "Visitors", "Leads", "Trials", "Customers". Percentages beside each level: 100%, 24%, 9%, 3%. Navy and orange palette, flat design, clean sans-serif text, generous spacing.
💡 If the percentages come out wrong, ask for a correction in a follow-up prompt, or add the numbers yourself in any slide editor. Never publish figures you have not checked.
Bakery Recipe Flow
A small shop owner wants a menu card that shows how a signature loaf is made.
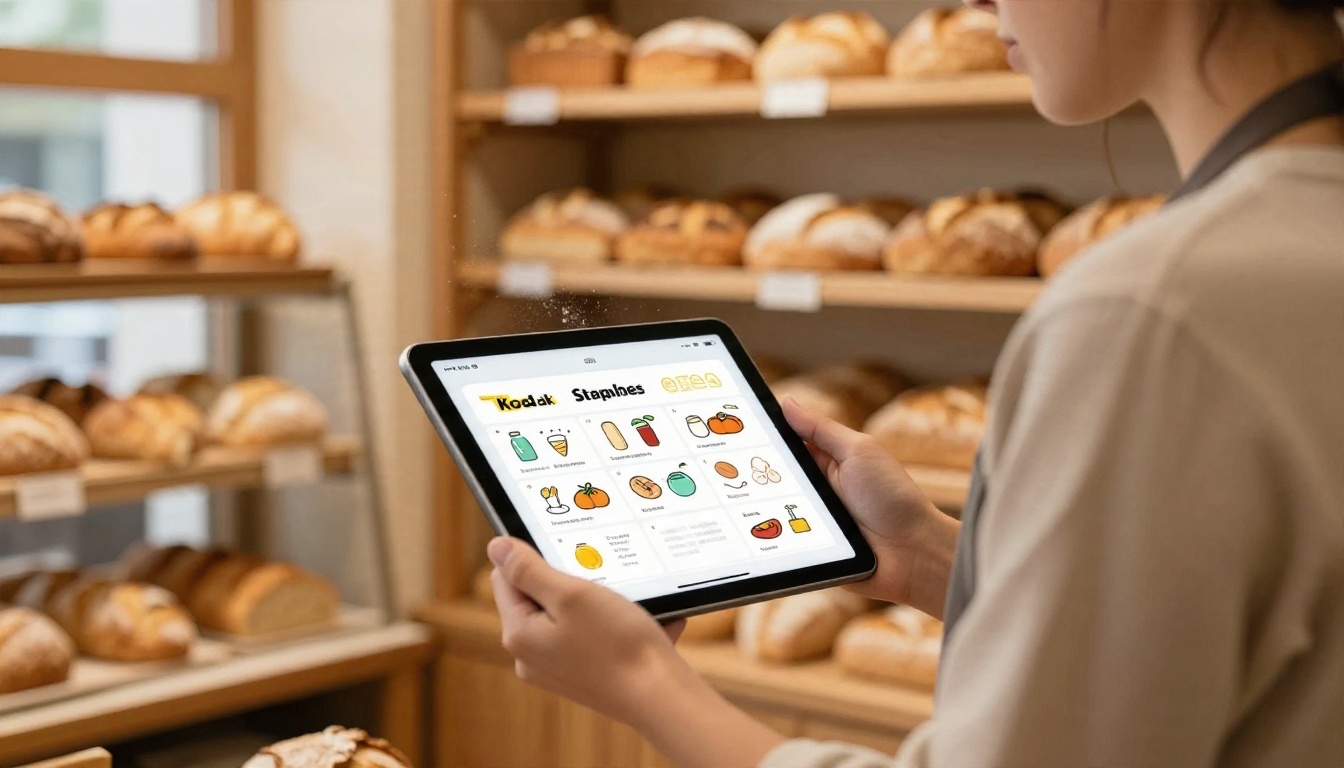
Prompt: Vertical recipe infographic for sourdough bread in 5 steps: "Mix", "Rest", "Shape", "Proof", "Bake". Warm hand-drawn style icons, cream background, terracotta and wheat colors, title "Sourdough" in large letters at the top.
Student Timeline
A student has to present the history of the internet and wants a visual that looks neat, not chaotic.

Prompt: Horizontal timeline infographic with six milestones from 1969 to 2007. Each milestone has a year, a two-word label and a small icon. Clean minimal style, light gray background, one accent color in teal, plenty of space between items.
Weekly Nutrition Plan
A health coach wants a printable sheet for clients.
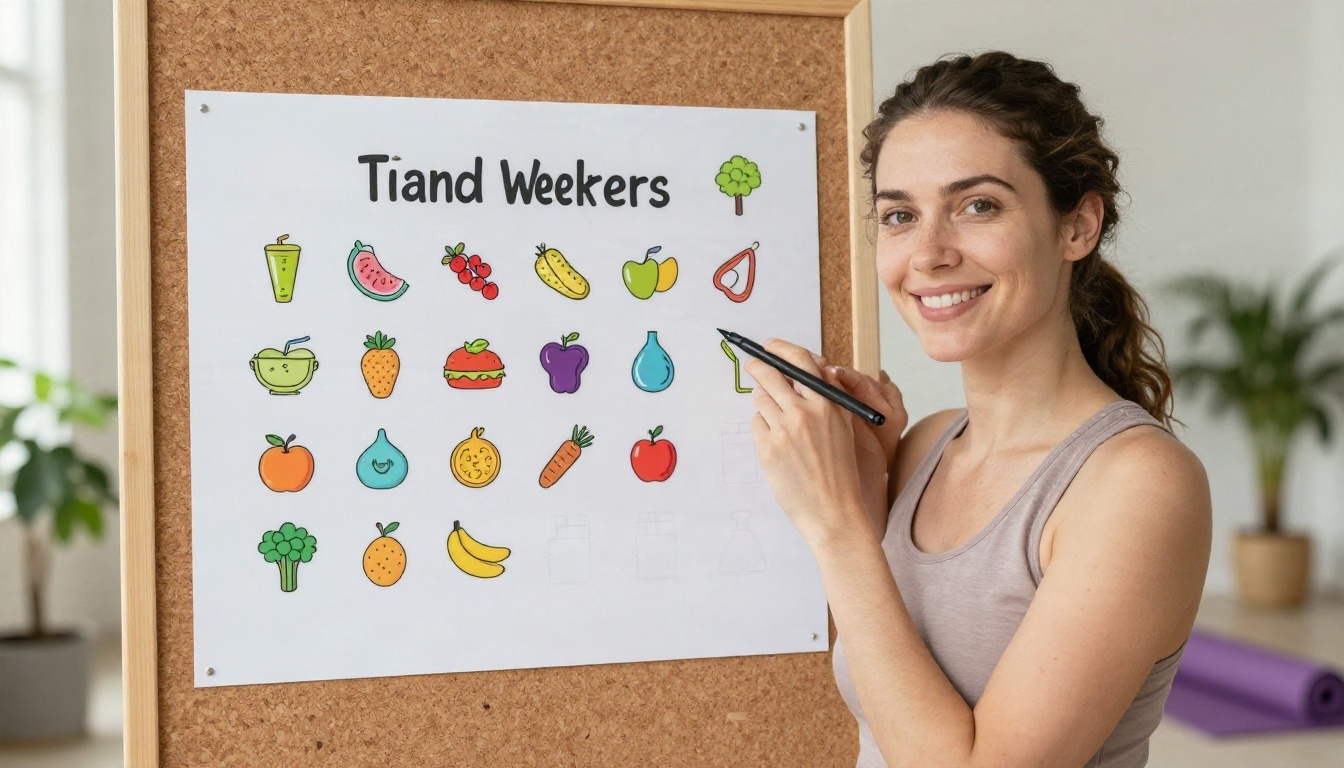
Prompt: Vertical weekly meal plan infographic with seven rows labeled Monday to Sunday. Each row shows three small food icons for breakfast, lunch and dinner. Fresh green and yellow palette, rounded shapes, white background, clear large headings.
Common Mistakes and How to Fix Them
Almost every beginner makes the same handful of errors. The good news is that each one has a fast fix.
Too Much Text
Long sentences inside a graphic rarely render well. The fix is to shorten every label to a word or a short phrase, and put the explanation in the caption of your post or the body of your document.
Wrong Aspect Ratio
A process with eight steps squeezed into a square looks cramped. A simple two-item comparison stretched into a tall poster looks empty. Pick the shape first, then write the prompt.
| Use case | Best ratio |
|---|
| Slide deck | 16:9 |
| Instagram or LinkedIn post | 1:1 or 4:5 |
| Pinterest or long explainer | 9:16 |
| Classroom or office poster | 2:3 or 3:4 |
Changing Everything at Once
If the first result is close but not right, resist the urge to rewrite the whole prompt. Change one thing: the palette, the heading, the layout. You will reach a good result in two or three rounds instead of ten.
Skipping the Proofread
Read every word out loud. AI can swap letters or invent a number that sounds plausible. A thirty-second proofread protects your credibility.
Print, Export and Polish
A graphic that looks great on a phone can fall apart on paper. If you plan to print, generate at the highest resolution available, then run the file through a super resolution tool to add sharpness. PicassoIA offers several upscaling models for exactly this step.
Then check the basics:
- Margins. Keep important text away from the edges so printers do not trim it.
- Contrast. Dark text on a light background prints reliably. Pale gray text on white disappears.
- Test print. Print one small copy before you order fifty.

💡 Workflow that saves time: Generate the background and layout with AI, then add your exact figures in a slide or document editor. You get a beautiful design and numbers you can trust.
Make Your First Infographic Today
You do not need a design degree, a paid subscription or a free weekend. You need a topic, five short labels and a prompt built on the five-part formula above.
Here is a simple plan for the next ten minutes:
- Pick one topic you already know well.
- Write five headings of six words or fewer.
- Choose a layout and two colors.
- Open Nano Banana Pro or Ideogram v4 Quality on PicassoIA and paste your prompt.
- Run the same prompt in a second model, then keep the winner.
Your first attempt will not be perfect, and that is fine. By the third round you will know what each model does well, and your prompts will get shorter and sharper. Head over to PicassoIA, try one of the examples above with your own topic, and see how quickly a plain sentence becomes something worth sharing.


