If you have spent time wrestling a complex spreadsheet formula into existence, only to realize the cell references were off by one column, you already know the problem. Most AI tools that claim spreadsheet support are doing surface-level pattern matching. They recognize =SUM() and =VLOOKUP() the way autocomplete recognizes common phrases, not the way an analyst tracks relationships across a data model. Claude Fable 5.1 works differently, and the difference becomes obvious in real office tasks.
Anthropic built the Fable series around extended structural reasoning. Where earlier models treated tabular data as a flat block of text, Fable 5.1 maintains awareness of cell ranges, column dependencies, and named references as a system. That foundation makes it genuinely useful for spreadsheet and presentation work in ways that feel less like prompting an AI and more like working with a technically competent colleague who has read your entire workbook.

Why Spreadsheets Break Most AI
Spreadsheets are structurally hostile to language models. The information is positional, relational, and often implicit. A cell containing =D4*$B$1 means nothing without knowing what column D and row 4 contain, and what the absolute reference in B1 represents. Most language models infer this from surrounding text if you describe it, but that description process puts the cognitive burden squarely on you.
The Context Window Problem
A real production spreadsheet with 40 columns and 10,000 rows contains more characters than many models can hold in context at once. Older generation models would silently truncate, generating formulas that looked correct but referenced ranges that did not exist in the portion they had seen. This is not a minor issue: it causes errors that pass visual inspection and only surface during audits, sometimes months later.
Formula Hallucinations
Earlier AI assistants invented function names that do not exist in Excel or Google Sheets. They combined real syntax with fabricated parameters. For users who are not already formula experts, these plausible-looking outputs are genuinely dangerous because they either produce an explicit error or, worse, a wrong number with no error indicator. A broken lookup that silently returns zero in a revenue model is harder to catch than a #NAME? error.
Structural Blindness
Beyond formulas, most models do not reason about spreadsheet structure. They do not track whether a conditional formatting rule conflicts with a data validation rule. They do not notice that your pivot table source range has been extended but the pivot itself has not been refreshed. They cannot tell you that two columns have a naming inconsistency that will break your VLOOKUP when the data refreshes. These structural issues are exactly where experienced analysts spend disproportionate time relative to the analytical work itself.

What Claude Fable 5.1 Changed
Fable 5.1 is a step forward in each of the problem areas above, not because Anthropic trained it on more spreadsheet tutorials, but because the model architecture handles positional and relational information with greater precision than its predecessors.
Extended Reasoning on Tabular Data
When you paste a table into Claude Fable 5.1, the model builds an internal representation of column headers, data types in each column, and row relationships before generating any output. This is what Anthropic describes as extended structural reasoning. In practice it means the model can answer questions like "which rows have a value in column C that is more than 20% above the column average" without you needing to pre-sort, pre-filter, or write an intermediate formula yourself.
The model also maintains that structural awareness across multiple follow-up messages in the same session. If you define that column B is a date field and column D is revenue, you do not need to restate that in every subsequent prompt. Fable 5.1 carries the schema forward.
The Formula Chain Problem
Complex spreadsheets use formulas that reference other formulas, which reference other formulas. An INDIRECT call inside a SUMPRODUCT inside an array formula is a chain that most models break at the first or second link. Fable 5.1 tracks these chains more reliably because its reasoning steps are explicit and serialized. You can see it working through the dependency graph in its responses, which also makes errors easier to catch before you implement anything.
Native Cell Reference Logic
One of the clearest improvements over Claude Sonnet 4.6 is that Fable 5.1 distinguishes correctly between relative, absolute, and mixed references without being prompted to. Ask it to write a formula that should lock the column but not the row, and it uses $A1 instead of $A$1. Ask it to write a formula that should copy identically across both rows and columns, and it uses $A$1. This sounds like a minor detail. When you are copying that formula across 200 rows and 15 columns, it is the difference between a working model and two hours of debugging.
💡 Tip: When giving Fable 5.1 a spreadsheet task, describe your column headers explicitly in the first line of your prompt. The model uses that structural description to anchor all subsequent formula references correctly and avoids placeholder column letters that do not match your actual file.
Real Spreadsheet Tasks It Handles
Here is where the practical value becomes concrete. These are the specific task categories where Claude Fable 5.1 consistently performs well across different user skill levels.

Formula Generation from Plain Language
You describe what you want in plain language, and the model returns a working formula. The quality of that formula depends on how precisely you describe the problem, but Fable 5.1 tolerates vagueness better than its predecessors and asks clarifying questions when the request is genuinely ambiguous rather than guessing wrong.
Prompt types that produce strong results on first attempt:
- "Give me a formula that returns the sum of column D only for rows where column B says Q3 and column C is greater than 1000"
- "Write a formula that finds the last non-empty cell in a column and returns the row number"
- "I need to calculate the percentage change from the previous month's value, handling division by zero gracefully"
- "Create a formula that extracts the domain name from a full email address in column F"
- "Return the rank of each value in column E, with ties ranked the same and no gaps in ranking"
Each of these produces a working formula on the first attempt in the majority of cases. For multi-condition array formulas, the success rate on first attempt is noticeably higher than with GPT 5, which handles simple cases equally well but shows more variance on complex nested logic.
Error Auditing and Debugging
Paste the formula that is breaking your spreadsheet, describe what it should return, and Fable 5.1 identifies not just the syntax error but the logical error underneath it. It explains why the formula produces the wrong result, not just that it does. This is the AI spreadsheet assistant behavior that experienced analysts actually need.
| Spreadsheet Task | Fable 5.1 | GPT 5 | Gemini 3.1 Pro |
|---|
| Single-condition SUMIF | Excellent | Excellent | Excellent |
| Nested multi-condition arrays | Strong | Moderate | Moderate |
| Dependency chain debugging | Strong | Moderate | Moderate |
| Named range management | Good | Moderate | Good |
| Dynamic array spill logic | Good | Good | Variable |
| Error code diagnosis | Strong | Good | Moderate |
| Cross-sheet reference logic | Strong | Moderate | Moderate |
Data Cleaning and Normalization
One of the most tedious spreadsheet tasks is normalizing messy input: inconsistent date formats, mixed currency symbols, leading and trailing spaces, inconsistent capitalization in categorical columns. Fable 5.1 handles these well through a combination of formula generation and direct text transformation when you paste the raw data directly into the conversation.
For a column with dates formatted as "Jan 5 2024", "01/05/24", and "2024-01-05" all referring to the same day, the model writes the DATEVALUE and TEXT combination to normalize all three formats to a consistent output. More importantly, it identifies the inconsistency pattern from the actual data rather than requiring you to describe it first.
💡 Tip: For data cleaning tasks, paste a sample of 10 to 15 rows rather than describing the problem in the abstract. The model infers the inconsistency pattern from actual data more accurately than from your description of it.
Slide and Presentation Work
Spreadsheets are half the story. The other half is turning data and analysis into slides that someone other than you can read and act on. This is where many knowledge workers spend disproportionate time relative to the actual thinking required.
Structuring Decks from Raw Notes
Give Fable 5.1 a dump of bullet points, meeting notes, or a research brief and ask it to structure a presentation. It generates a logical slide sequence: context, problem, data, options, recommendation, next steps. The sequencing reflects genuine rhetorical logic, not just a bulleted list cut into sections.
The model also proposes which data points belong on which slide and explains the reasoning. That is a different behavior from simply summarizing the content. It is making decisions about visual hierarchy and narrative flow, which is the actual cognitive work that takes time when you build decks from scratch.
Chart and Table Suggestions
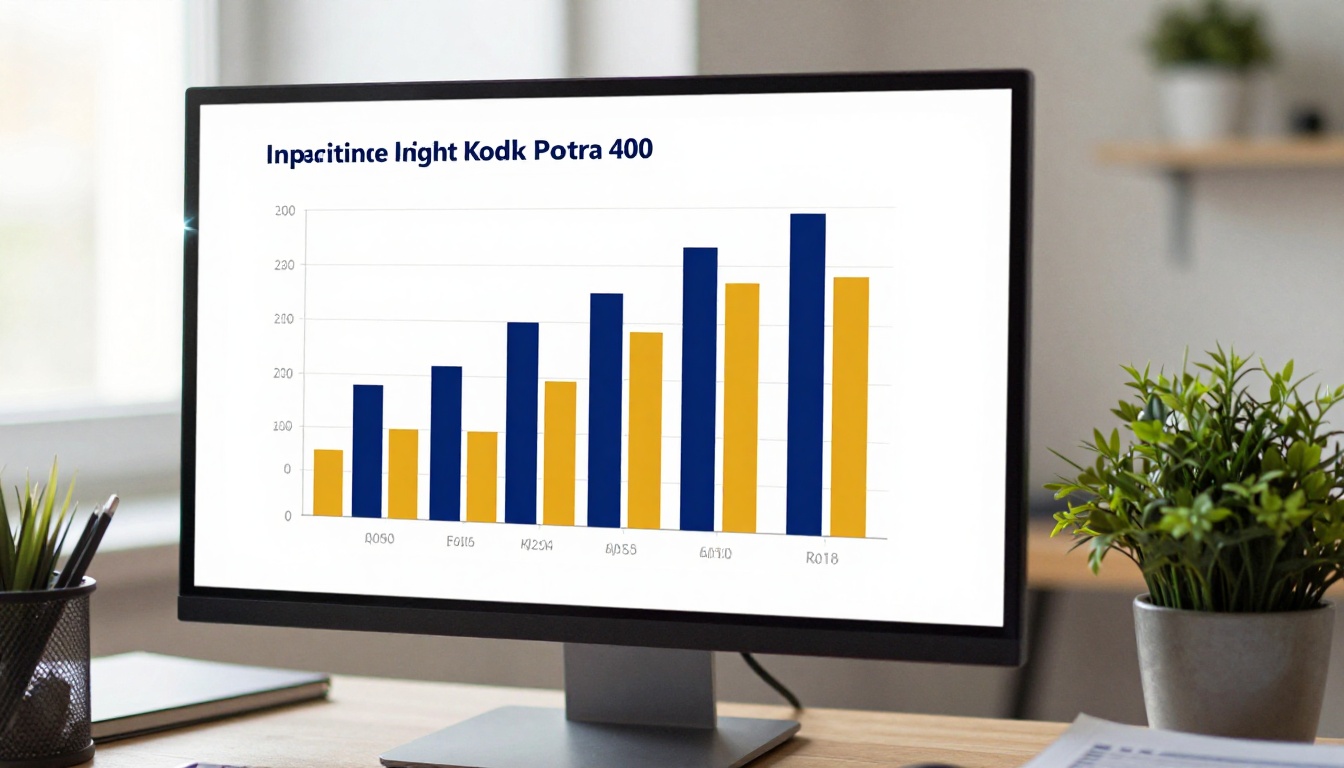
When you describe a dataset or paste summary statistics, Fable 5.1 recommends the right chart type and explains the reasoning. Bar chart for category comparisons. Line chart for time series. Scatter plot for correlation analysis. Waterfall chart for variance attribution. These are not always surprising recommendations, but the explanations it gives for each choice are useful for anyone building a case for why the data should be presented a particular way to a specific audience.
| Slide Type | Fable 5.1 Output Quality |
|---|
| Executive summary | Very strong, clear hierarchy, actionable bullets |
| Data comparison | Strong, appropriate chart type selection |
| Process flow | Good, logical step sequencing |
| Financial model narrative | Strong, formula-to-English translation |
| Team and org structure | Moderate |
| Complex infographics | Limited, text-only output |
Executive Summary Slides
This is where Fable 5.1 is most immediately valuable for presentation work. Ask it to write the executive summary slide for a financial report, and it produces a tight three to five bullet structure where each bullet is a complete, actionable insight rather than a category label. "Revenue declined 8% in Q3, driven primarily by the EMEA segment" instead of "Revenue: EMEA performance."
The difference is between a slide that communicates and a slide that requires the presenter to do all the communication verbally during the meeting. Executives reading the deck in advance get the substance without the presentation.

How to Use Claude Fable 5.1 on PicassoIA
Claude Fable 5.1 is available directly on PicassoIA's large language model catalog. No API keys, no local setup, no token limits to manage manually.
Step 1: Open the Model
Go to the Claude Fable 5 page on PicassoIA and open the chat interface. The model loads with full context capacity, so you can paste substantial data tables without manually chunking them into separate messages.
Step 2: Paste Your Data or Describe Your Task
For formula tasks, paste the column headers and a representative sample of rows from your spreadsheet. For presentation tasks, paste your notes, brief, or a description of the conclusions you need the deck to communicate. For debugging tasks, paste the broken formula and a description of what it should return.
Three input formats that work reliably:
- Table paste: Copy cells directly from your spreadsheet. The tab-delimited format that Excel and Google Sheets produce when you copy is readable by the model.
- CSV snippet: A few rows in CSV format with a header row works equally well.
- Plain description: For simpler formula requests, a precise English description is sufficient. Include column names and the expected output type.
Step 3: Iterate
Fable 5.1 is precise, not perfect. The first response is usually 70 to 90% of what you need. The remaining gap closes quickly with one or two follow-up messages where you specify what to adjust. This iterative loop is faster than trying to write a perfect prompt upfront, and it uses the model's ability to maintain context across the conversation.
💡 Tip: If the formula the model gives you returns an error in your spreadsheet, paste the error message directly into your follow-up. Fable 5.1 diagnoses specific error codes and corrects the formula in the same response.

How It Compares to Other LLMs
Honest comparison matters for deciding which model to reach for in a given situation. Not every task needs Fable 5.1.
vs. GPT 5
GPT 5 is the clearest alternative for office productivity work. For simple to moderately complex formulas, the two models perform similarly. For multi-step formula chains, nested conditionals, and explicit dependency debugging, Fable 5.1 has a measurable edge in consistency. GPT 5 tends to produce cleaner prose in the explanatory text it wraps around formulas, which matters if you are generating documentation alongside the formulas themselves.
vs. Gemini 3.1 Pro
Gemini 3.1 Pro benefits from deep Google Workspace integration when used through Google's own tooling. For pure language model interaction through a chat interface, Fable 5.1 produces more consistent formula output. Gemini 3.1 Pro is stronger on multimodal tasks, specifically reading charts and images of spreadsheets, where its vision capabilities outperform text-only interaction.
vs. Claude Sonnet 5
Claude Sonnet 5 is faster and less resource-intensive than Fable 5.1 for tasks that do not require heavy structural reasoning. For simple formula generation and basic slide structuring, Sonnet 5 is often the right choice. For debugging complex multi-sheet workbooks, producing presentation narratives from dense quantitative data, or handling formula chains with four or more levels of nesting, Fable 5.1's deeper reasoning is worth the tradeoff.

Where It Still Falls Short
Transparency matters. These are the areas where Fable 5.1 is not the right tool.
Very Large Datasets
If your spreadsheet has 500,000 rows and 80 columns, you cannot simply paste it. You need to describe the structure, paste a representative sample, and provide summary statistics. The model works with what it sees in the conversation, not with what is in your file. For these tasks, a purpose-built data analysis environment with direct file access remains necessary. Fable 5.1 is useful for designing the analytical logic even if it cannot execute it directly on your full dataset.
Complex Conditional Formatting
Fable 5.1 can describe a conditional formatting rule in plain language and write the formula logic behind it, but it cannot directly apply it to your file. It outputs instructions or code for you to implement. For users who want click-by-click application of formatting rules, that implementation gap still requires manual work. The formula logic it generates is correct; the application step is yours.
Slide Visual Design
The model outputs text and structure, not finished visual presentations. It will tell you that a slide should use a side-by-side comparison layout with a small callout chart on the right, but it will not produce that slide as a file. For visual output, you bring the content Fable 5.1 generates into your presentation tool and apply the design there. The thinking is automated; the clicking is not.
💡 Tip: For models that can extract data from chart and table images, consider Granite Vision 4.1 4B, which specializes in reading visual data structures and translating them back into structured text for further processing.

Start Using It on Your Real Data
The most useful thing you can do after reading this is close it and open Claude Fable 5.1 on PicassoIA with an actual formula problem or presentation task sitting on your desk right now.
The model rewards concrete input. The more specific the data you paste, the more specific and accurate the output. Start with the spreadsheet problem that has been annoying you the longest, paste the relevant rows and the broken formula, and compare the diagnostic response to what you have been getting from other tools.
If you want to go beyond spreadsheets and slides, PicassoIA's full catalog of large language models gives you access to Claude Opus 4.7 for the heaviest reasoning tasks, Claude 4.5 Haiku for fast and lightweight queries, and Deepseek R1 for mathematical chain-of-thought work. Each model has a different operating profile, and the ability to switch between them in a single session is one of the practical advantages of working through PicassoIA.
The spreadsheet is still yours to build. The analysis is still yours to own. What Fable 5.1 removes is the friction between knowing what you need and having the formula or slide structure that delivers it.